The CSS draws a border around the canvas.
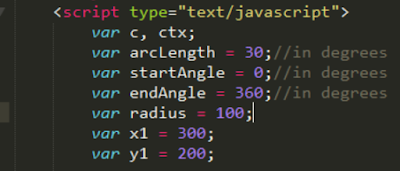
Just like the previous blog, the JavaScript code starts by declaring the c and ctx variables. These will hold the canvas HTML object and define the context of the canvas respectively. Unlike the previous blog wherein the arc angle parameters are in radians, I assigned the parameter values in degrees. The x1 and y1 variables will be the center position of the arc.
The function init() is called when all HTML elements have been rendered.
The function draw() calls the JavaScript built-in function setInterval(). Parameters are the callback function and millisecond interval when the callback function is triggered.
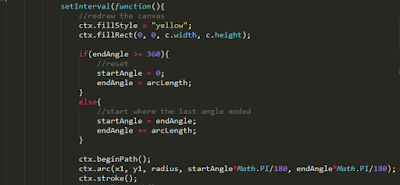
The callback function clears any previous drawn object by refilling the canvas with yellow color, i.e. gives an animating effect. The variables startAngle and endAngle are incremented with the arc length (degree). Once the endAngle reaches 360 (degrees), both startAngle and endAngle are reset to their default values. The arc lis drawn using degree values.
The x and y coordinates of the endAngle end degree are computed.
A line is drawn from the center of the arc to the end point defined by the x and y coordinates.
The code is listed below.
<!DOCTYPE html>
<html>
<head>
 <title>Animating circle</title>
 <style type="text/css">
  canvas{
   border:1px solid #000;
  }
 </style>
 <script type="text/javascript">
  var c, ctx;
  var arcLength = 30;//in degrees
  var startAngle = 0;//in degrees
  var endAngle = 360;//in degrees
  var radius = 100;
  var x1 = 300;
  var y1 = 200;

  function init(){
   c = document.querySelector("#myCanvas");
   ctx = c.getContext("2d");
   ctx.strokeStyle = "red";

   draw();
  }

  function draw(){

   setInterval(function(){
    //redraw the canvas
    ctx.fillStyle = "yellow";
    ctx.fillRect(0, 0, c.width, c.height);

    if(endAngle >= 360){
     //reset
     startAngle = 0;
     endAngle = arcLength;
    }
    else{
     //start where the last angle ended
     startAngle = endAngle;
     endAngle += arcLength;
    }

    ctx.beginPath();
    ctx.arc(x1, y1, radius, startAngle*Math.PI/180, endAngle*Math.PI/180);
    ctx.stroke();
    //ctx.closePath();

    // compute x and y coordinates of the end angle relative to canvas
    var x2 = x1 + Math.cos(endAngle * Math.PI / 180) * radius;
    var y2 = y1 + Math.sin(endAngle * Math.PI / 180) * radius;

    console.log('startAngle', startAngle);
    console.log('endAngle', endAngle);

    console.log('x2',x2);
    console.log('y2',y2);

    console.log('x2 end',x2|0);
    console.log('y2 end',y2|0);

    console.log(startAngle*Math.PI);
    console.log(endAngle*Math.PI);

    console.log('***');

    ctx.beginPath();
    ctx.moveTo(x1, y1);
    ctx.lineTo(x2, y2);
    ctx.stroke();
    //ctx.closePath();

   }, 50);

  }
 </script>
</head>
<body onload="init();">
 <canvas id="myCanvas" width="600" height="400"></canvas>
</body>
</html>
The code is also available at this jsfiddle link, https://jsfiddle.net/dyy5xtv2/


No comments:
Post a Comment